LOOK WESTWARD from the cliffs of Davenport, California, just north of Santa Cruz, and you’ll feel as though you’re standing at the edge of the world. The blue Pacific Ocean stretches unbroken to the horizon, a liquid mirror throwing the yellow sun back up to the sky. |
||
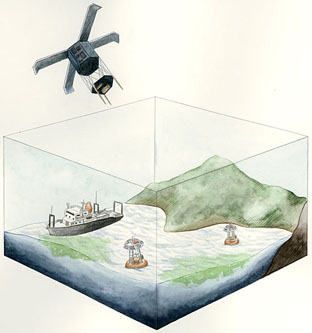
Sometimes a camera hundreds of miles up in the sky offers the best perspective on microscopic sea plants. |
If you could see absolutely everything through that mirror, you’d observe a space teeming with all kinds of life, from the biggest whale to the most microscopic bits of plant-like aquatic organisms called algae. And if you could gaze infinitely skyward past the bright sun, you’d catch a glimpse of a satellite that biologists are using to study this vast web of life, starting with the algae. It’s funny to think that scientists are using high-tech space satellites, and not microscopes, to study such tiny lifeforms. But the approach makes perfect sense to marine biologists such as Raphael Kudela of the University of California at Santa Cruz, who is trying to understand the balance of life in the ocean. In the marine realm, as on land, small creatures get eaten by bigger animals, which get devoured by still larger predators, and so on. Thus energy in the form of food travels up the so-called food chain. But exactly what controls the growth of sea life? "Where does the energy go? These are biologists’ big, driving questions," says Kudela. Scientists know that one important kind of algae, called phytoplankton, forms the base of the food chain. The microscopic phytoplankton hold a key to many riddles about everything from global warming to overfishing. If scientists could measure exactly how much phytoplankton floats around in the ocean, for instance, they could make reasonable predictions about how many fish, whales, sea turtles, or sharks the ocean can feed. And knowing that answer would help answer the urgent question of how much humans can fish without upsetting the ocean’s ecosystem or pushing different species towards extinction. Alternatively, monitoring how phytoplankton respond to changes in climate from natural or manmade causes might offer clues to the planet’s state of health. Now, studies by Kudela and a colleague are taking a closer look at these tiny fish-snacks. Kudela has been using satellite pictures of the Pacific Ocean off central California in a new formula for predicting the amount of phytoplankton, in pounds, that will become food for fish in the area on any given day, month, or year. This new phytoplankton growth model, which Kudela developed together with marine biologist Francisco Chavez of the Monterey Bay Aquarium Research Institute (MBARI), combines data collected from boat cruises, aquarium moorings, and most importantly, the satellite. The best thing about using a satellite to do algae research, say the biologists, is that it gives them a view they can’t get anywhere else. "Satellites are the only way to get that really big picture," says Kudela. "On a boat you can only go out so far and get so much data. You’re always wondering if you’re getting the big picture or not."
WHEN SCIENTISTS USE SATELLITES to study the land or the sea, they call it remote sensing. First used decades ago to observe dry land, the technology taught scientists about the complex seasonal and yearly changes of plants, animals, and geography. The tool was so helpful that marine researchers soon wanted to see whether it would unlock the secrets of the oceans, too. Kudela studies pictures of Monterey Bay and beyond taken by a satellite called the Sea-Viewing Wide Field Sensor, or SeaWiFS, which is owned by NASA and Oribmage, a private company. The three-foot-long, torpedo-shaped satellite was lofted into space five years ago by a cruise missile launched from the back of a 747 jet. Every day, SeaWiFS beams images from all over the globe to more than 80 subscribers worldwide, including Kudela. SeaWiFS takes pictures at eight different wavelengths of light. It takes one photograph each of violet, blue, yellow, green, and red light and infrared heat that radiates back to space from the ocean’s surface. Images recorded at the other two wavelengths allow researchers to correct for the scattering of light that occurs in the earth’s atmosphere. Each color reveals something different about the ocean. Green light, for example, tells scientists how much green chlorophyll–a pigment found in algae–is floating at the surface. SeaWiFS data has proven a goldmine for a range of applications. Scientists use the satellite to track the movement of surface ocean currents that are otherwise invisible to the eye. Because water currents each have their own unique temperature, the satellite can detect them; it measures temperature by reading the infrared heat signal at the ocean’s surface. The satellite is sensitive enough to distinguish between currents only one-twentieth of a degree apart. SeaWiFS can also follow currents of dissolved sediment and pollutants as they run from rivers and dissipate into the ocean. Still other investigators use satellite photos to track phytoplankton to figure out what ocean conditions give rise to blooms of toxic algae. Called red tide, these dangerous blooms poison fish, seals, and shellfish. They can also make humans terribly sick. Phytoplankton are generally underrated, Kudela says, but they’re important to the planet. Fully half of the plants at the bottom of the global food chain live and grow in the ocean. Anchoring that chain, phytoplankton feed on inorganic nutrients such as carbon, nitrogen, and ammonia that enrich cold ocean water. Chlorophyll pigments in the algae absorb sunlight and allow them to turn those nutrients into more phytoplankton, via a process called photosynthesis. Because of this talent for making something out of nothing, ocean biologists call them "primary producers." Most biologists working on the problem of primary production first calculate the weight of phytoplankton produced in a given time frame. Then they roughly estimate what percentage of the algae will be eaten by animals. Kudela and Chavez say they’ve created a better formula that skips the first step and instead directly calculates how many pounds of phytoplankton travel up the food chain into the bellies of crustaceans, fish, whales, and the like. The researchers call this measure "new primary production." "Most biologists are still looking at primary production," Kudela says. "But the new primary production is really what you want to be measuring if you’re interested in where most of those nutrients are going." To arrive at their calculation, they plug five pieces of data into a computer equation. The first three come from SeaWiFS: the surface temperature of the ocean water, the amount of chlorophyll in the water, and information about which direction the chlorophyll is moving. The researchers also include water temperature at about six hundred feet below the surface, and wind speed and direction in their calculations. "It’s an integrated observing system," says Chavez. "We use data from ship point measurements, moorings, and satellites." Each data source provides essential information, but the satellite provides a valuable comprehensive view of Monterey Bay. Case in point: An interesting pattern emerged when the researchers compared images of the open ocean with those taken near the coastline. Far offshore, the ocean reflects only a deep blue color back to SeaWiFS. That’s because there’s very little phytoplankton floating at the surface so far from land. Most of it grows in shallow waters off continental coasts, where cold, mineral-rich water from the ocean floor slides up the continental shelf to the surface. This water has likely been flowing along the ocean floor for thousands of years, absorbing nutrients released by decomposing plants and fish before reaching the surface. One plume of this water wells up right off the coast of Davenport. From there, one current travels north towards Alaska, while another moves south into Monterey Bay. So far, Chavez and Kudela are pleased to report that their formula is accurate within a factor of two at predicting new primary production in Monterey Bay. That means that if the mathematical model predicts two pounds of phytoplankton per cubic yard of ocean water, the actual value would lie somewhere between one and four pounds. With a reliable formula in hand, the scientists can estimate how much food is in the ocean to support fish. Laws of nature say that an animal population will grow if there’s ample food, but shrink if substenance becomes scarce. Instead of trying to count all the fish hiding deep in the ocean-an impossible task-scientists can calculate population numbers by simply looking at how much food the fish have. Then, in turn, they can estimate how many fish could be harvested without harming the survival of different species. With the oceans in increasing danger from overfishing, Kudela and Chavez’s formula will add some certainty to a field dominated by guesswork. "Many people are worried that we’re taking more out of the oceans than we can support," says Kudela. He hopes environmental agencies will someday use the new primary production estimates to set limits on fishing. The formula could even help provide independent scientific verification of whether fishermen are really restricting their catches to the numbers they report, he says.
RECENTLY, KUDELA AND CHAVEZ were able to test their model by retrospectively crunching data collected under the extreme conditions of the El Nino weather pattern during the winter of 1997 to 1998. Along the central California coast during that period, many seals and sea lions washed up on shore, dead or dying of starvation. Seventy-five percent of sea lion pups died that breeding season, and the average weight of a weaned elephant seal was the lowest ever recorded. To a lesser extent, the same thing had happened during the 1992 - 1993 El Nino. Why? El Nino had tipped the ocean’s balance and brought abnormally warm water to California. Scientists know that phytoplankton cannot thrive in warm water, which lacks the nutrient richness of the old, cold water from the ocean floor. The devastation at the base of the food chain rippled up to the top. Without phytoplankton, the fish had little to eat. And without fish, animals starved. Oddly, however, readings from the moorings operated by the Monterey Bay Aquarium six and twelve miles offshore didn’t record much of a difference in phytoplankton levels, and this puzzled researchers. Some theorized that the inner bay had sheltered a large amount of phytoplankton from the warm water, and that the real damage had occurred just beyond their instruments. But they couldn’t prove it. Fortunately, SeaWiFS, which was launched in the summer of 1997, had recorded the whole thing. When Kudela and Chavez finished looking at its pictures, they found proof that the theory was right. Warm water had reduced the phytoplankton population two hundred miles offshore to just one fifth of its usual size. Most fish had migrated out of the bay and beyond to colder waters, where they could find food. But many of the sea lions and seals that stayed behind starved, because so little was left for them to eat. What’s more, when Kudela and Chavez ran the SeaWiFs data through their formula, results showed that 98 percent of the phytoplankton that normally becomes food was killed or failed to grow in the warm El Nino waters. The extent of the mass starvation made even more sense. Beyond the California coast, the new model can be customized to help other researchers studying other parts of the ocean. A complex environment like Monterey Bay, with wind and currents coming from all directions, requires different numbers than a more stable system, like the open ocean. Andrew Thomas, a marine biologist at the University of Maine at Orono, uses SeaWiFS data to study red tide in the Gulf of Maine, and to track how ocean color changes as a result of upwelling currents–one way of monitoring the health of the oceans. Thomas says a formula to predict new primary production would be highly useful to his studies. "It’s one of the missing parts we have to have," he says. Keeping track of the yearly cycle of new primary production is one more tool biologists can use to keep tabs on ocean conditions, says Kudela. "You can watch to see the impacts that humans have had over time," he says. With so much uncertainty about how global warming will affect the oceans, monitoring them closely has become especially important.
Scientists forecast another El Nino for the coming
winter of 2002-2003. Californians everywhere are groaning
with dread, but Kudela and Chavez are getting excited.
It’s another chance for them to further test and
refine their formula under another set of extreme weather
conditions. Next winter’s SeaWiFS pictures will bring
more answers, and they just can’t wait. |
|